Technical project case study
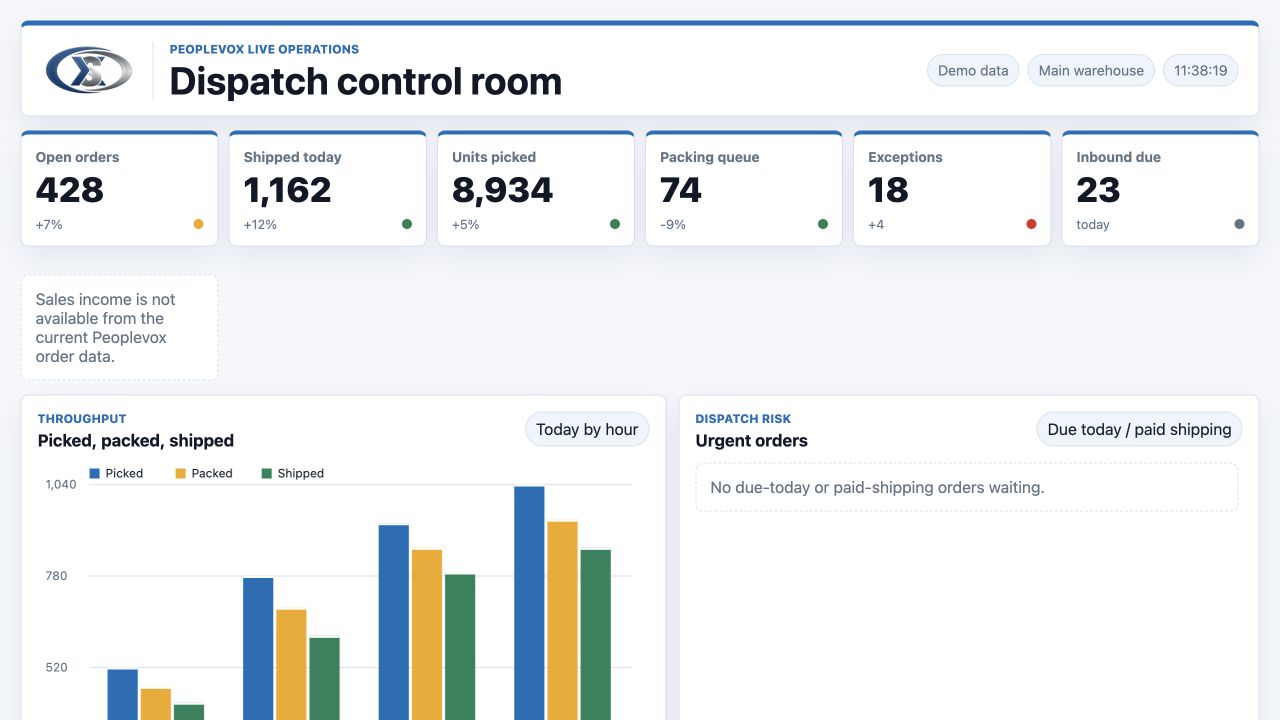
A standalone Python dashboard was built around live Peoplevox reporting to give warehouse and customer-service teams a quicker view of queues, urgent work, dispatch activity, stock and exceptions.
01The operational problem
Warehouse information existed, but it was spread across reports, screens and operational knowledge. Answering apparently simple questions—what must leave today, which queue is growing, who has dispatched work, what is waiting and what needs escalation—required repeated navigation and report generation.
A dashboard could solve the visibility problem, but only if it avoided becoming another source of truth. It also had to respect the fact that some Peoplevox reports take more than a minute to generate and that different teams should not see the same controls.
02What was built
ECom Clarity created a standalone Python application that reads Peoplevox through the appropriate SOAP and authenticated reporting interfaces, normalises the results and presents them in a single responsive dashboard. Views include pick and dispatch queues, urgent paid-shipping orders, recent sales income, stock analytics, back-order exports and dispatch by user.
The design later expanded into role-specific warehouse, shop and customer-service views. Peoplevox remains authoritative; the dashboard provides a faster operational lens and guarded workflow tools around that data.
03Technical design
- Python application serving both the dashboard and its internal API from one deployable service.
- SOAP GetData access for suitable operational datasets and authenticated reporting endpoints for saved reports.
- Background refresh worker that builds a completed snapshot while browsers read cached results.
- Role-scoped sessions for warehouse management, customer services, shop damages and specialist workflows.
- Formatted Excel generation for back orders grouped by warehouse location range.
- Production deployment through systemd, reverse proxying, health checks and atomic Git-based releases.
04Controls, failure handling and operational safety
- Provider credentials and bearer tokens remain server-side.
- Slow report generation is isolated from browser requests so one user cannot trigger overlapping Peoplevox workloads.
- The UI identifies data age and refresh state rather than implying every tile is instantaneous.
- Restricted roles expose only the pages and APIs required for that job.
- Deployment retains a previous application version and restores it automatically if the service or health check fails.
05Why the design matters
The design reduces the time between an operational condition appearing and somebody recognising it. It does not replace warehouse discipline or Peoplevox reporting; it makes the most decision-relevant signals easier to see together.
Combining software engineering with warehouse process knowledge was essential. A technically correct dashboard would still fail if its tiles did not reflect the way dispatch priorities, locations and exception queues are actually managed.
06What this project demonstrates
- Hands-on Peoplevox reporting and operational interpretation.
- Integration of slow upstream reports into a responsive user experience.
- Role-based access and careful separation of read-only insight from live actions.
- Production deployment, monitoring and rollback—not only a dashboard prototype.
07Practical lessons for similar integrations
A warehouse dashboard should answer operational questions, not reproduce every WMS field. Start with the decisions each role must make and trace each tile back to an authoritative dataset.
Caching is not merely a performance feature. When the upstream system is slow, a timestamped completed snapshot is often safer and clearer than allowing every browser request to launch a fresh report.